Monitoring
We use several tools to gain insight into performance at each level of our infrastructure.
For many system metrics we use Collectd. Typical metrics include CPU, disk, network (including OVS stats), and also metrics specific to some of our services such as HAproxy and Ceph processes details. To configure collectd we use a puppet-collectd module.
Ceph Metrics are gathered by a plugin to ceph-mgr originally written by a U-M student while working for our project. The plugin was contributed back to Ceph where it has seen significant modification since then. Some details about the plugin are covered in our article and you can also find out more information from the Ceph documentation.
For new deployments considering the question of Ceph metrics and monitoring you may also want to look into Prometheus. It also has a ceph-mgr plugin for exporting stats.
In our case we feed metrics from ceph-mgr and from Collectd to InfluxBD. We run our own instance of the open source edition with NVMe storage.
We take the stats from Influxdb and use Grafana to construct dashboards for monitoring Ceph status, system status, etc.
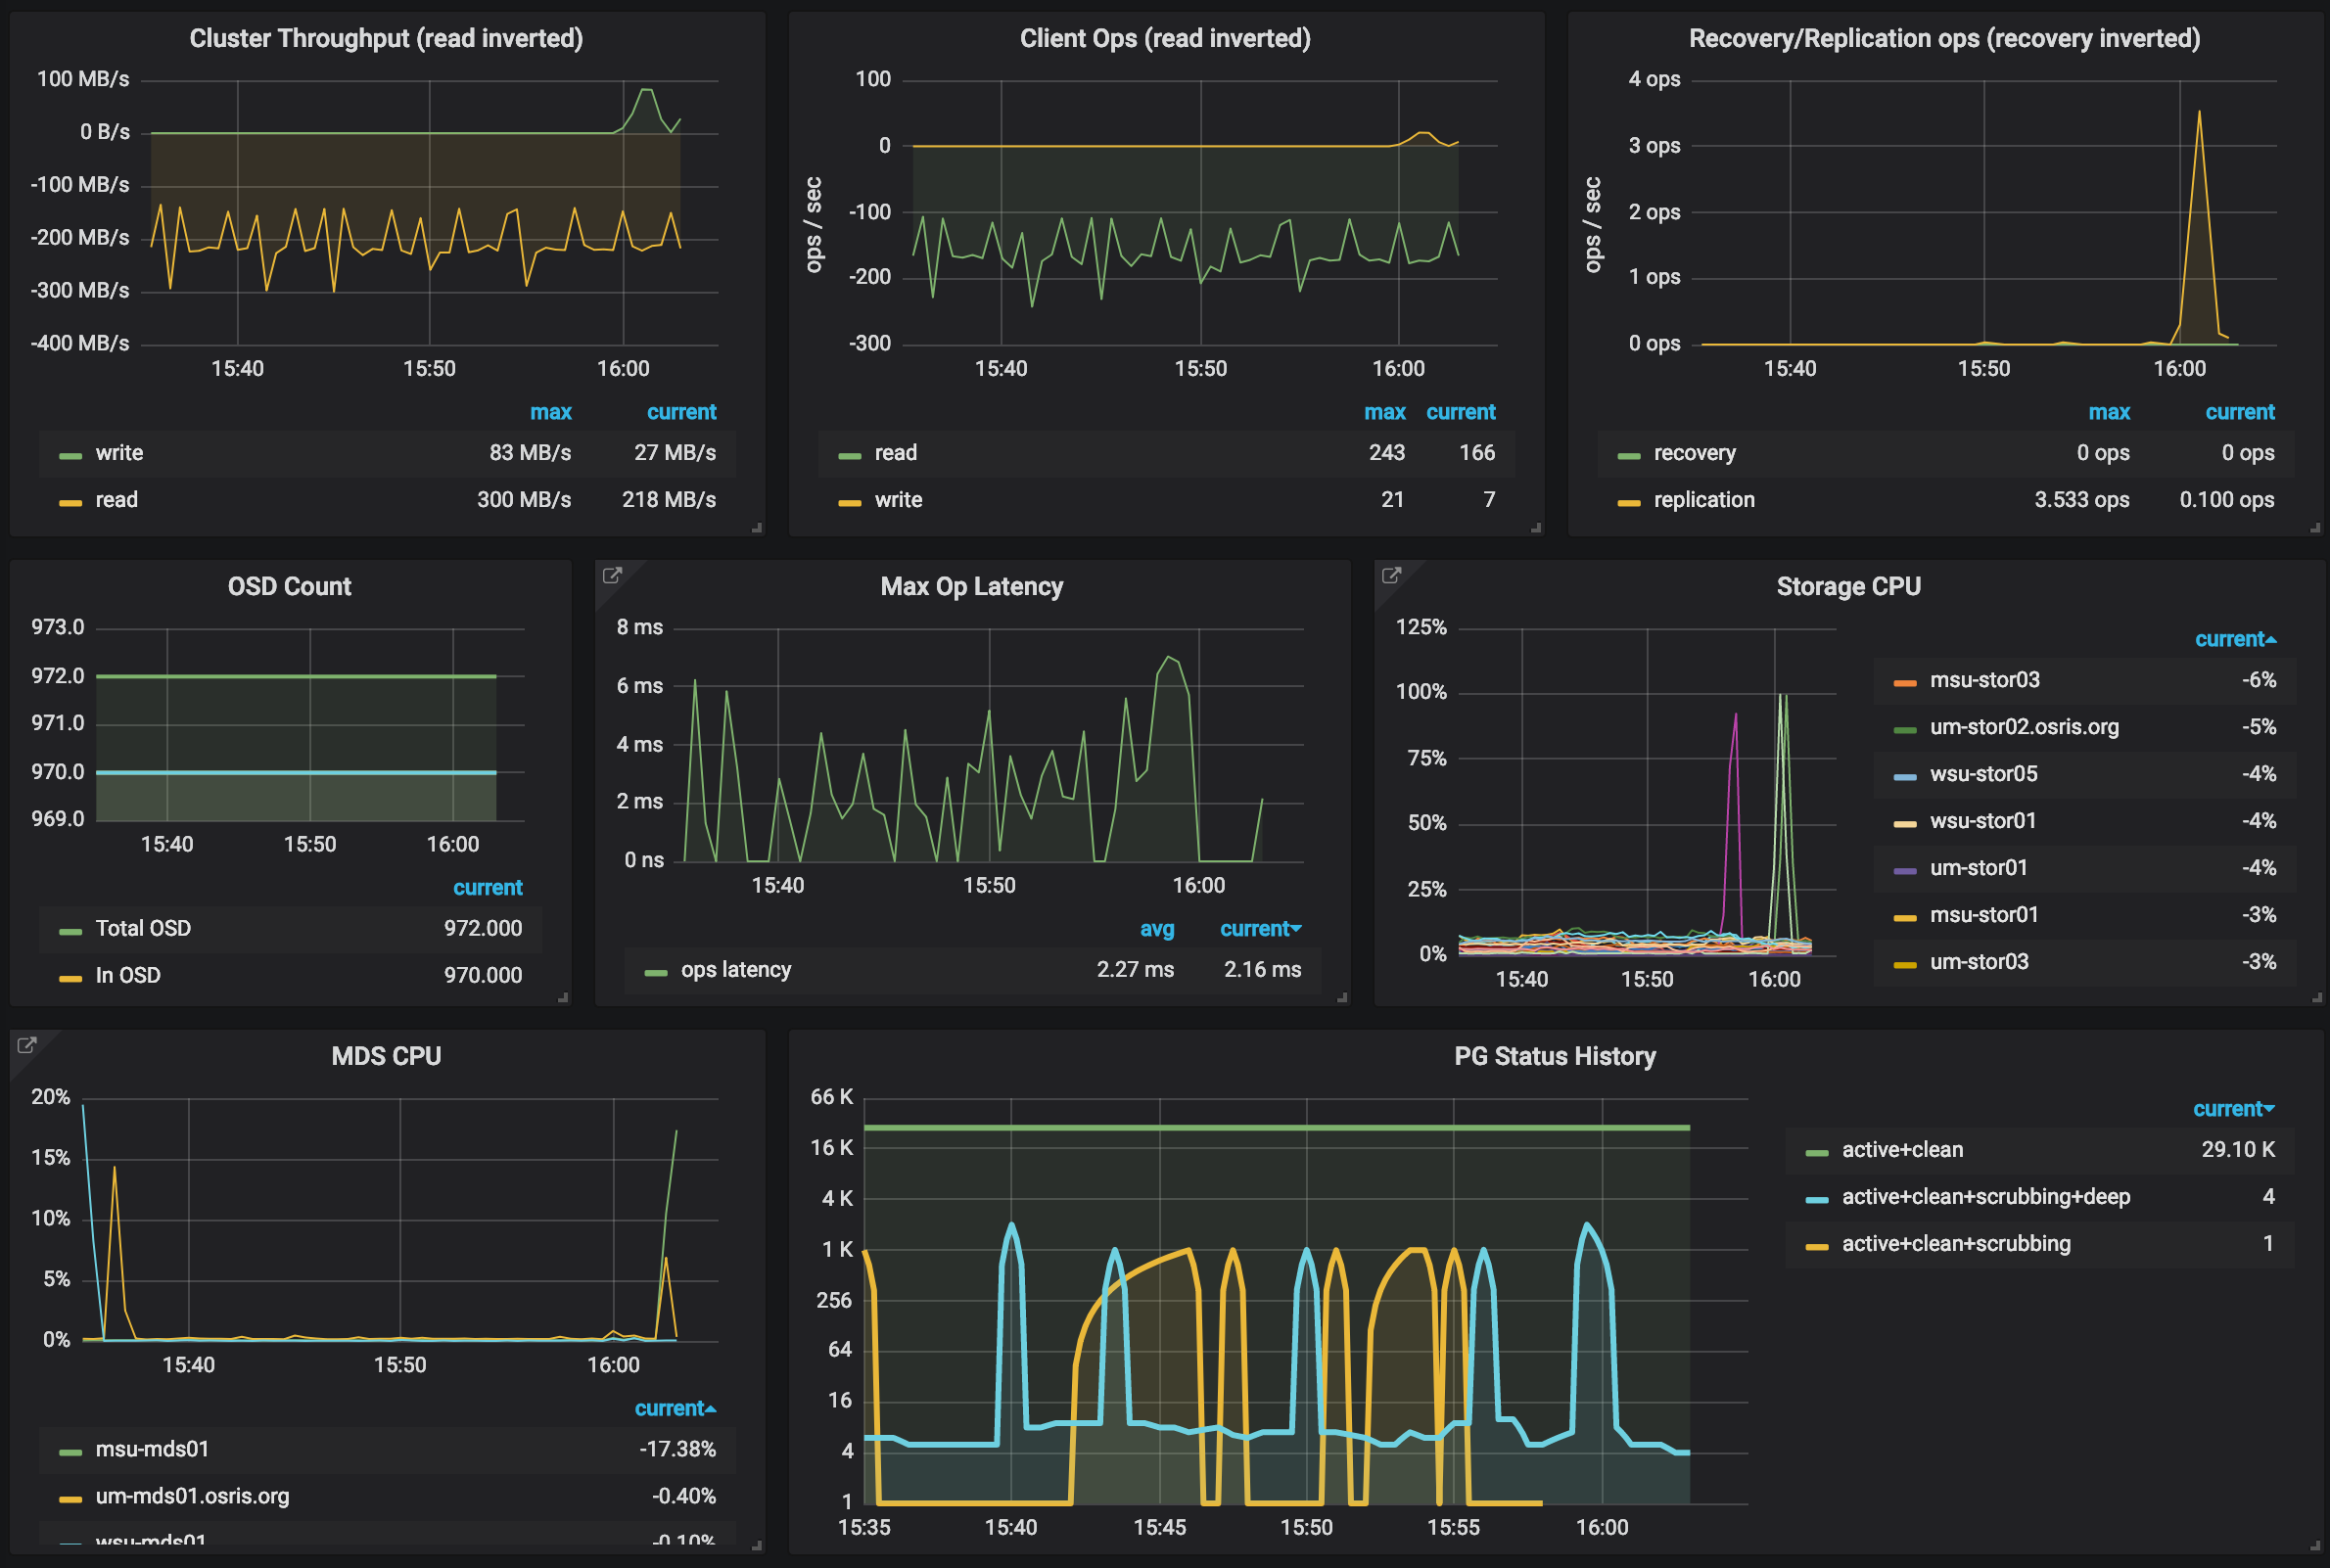 OSiRIS Cluster Dashboard combining Ceph metrics from manager plugin and system metrics gathered with Collectd
Metric/stats collection is done with Collectd on host systems feeding instances of Influxdb. We then visualize this data with Grafana. A variety of Collectd plugins gather data about Ceph, system performance, network throughput, switch interfaces (snmp plugin), and more.
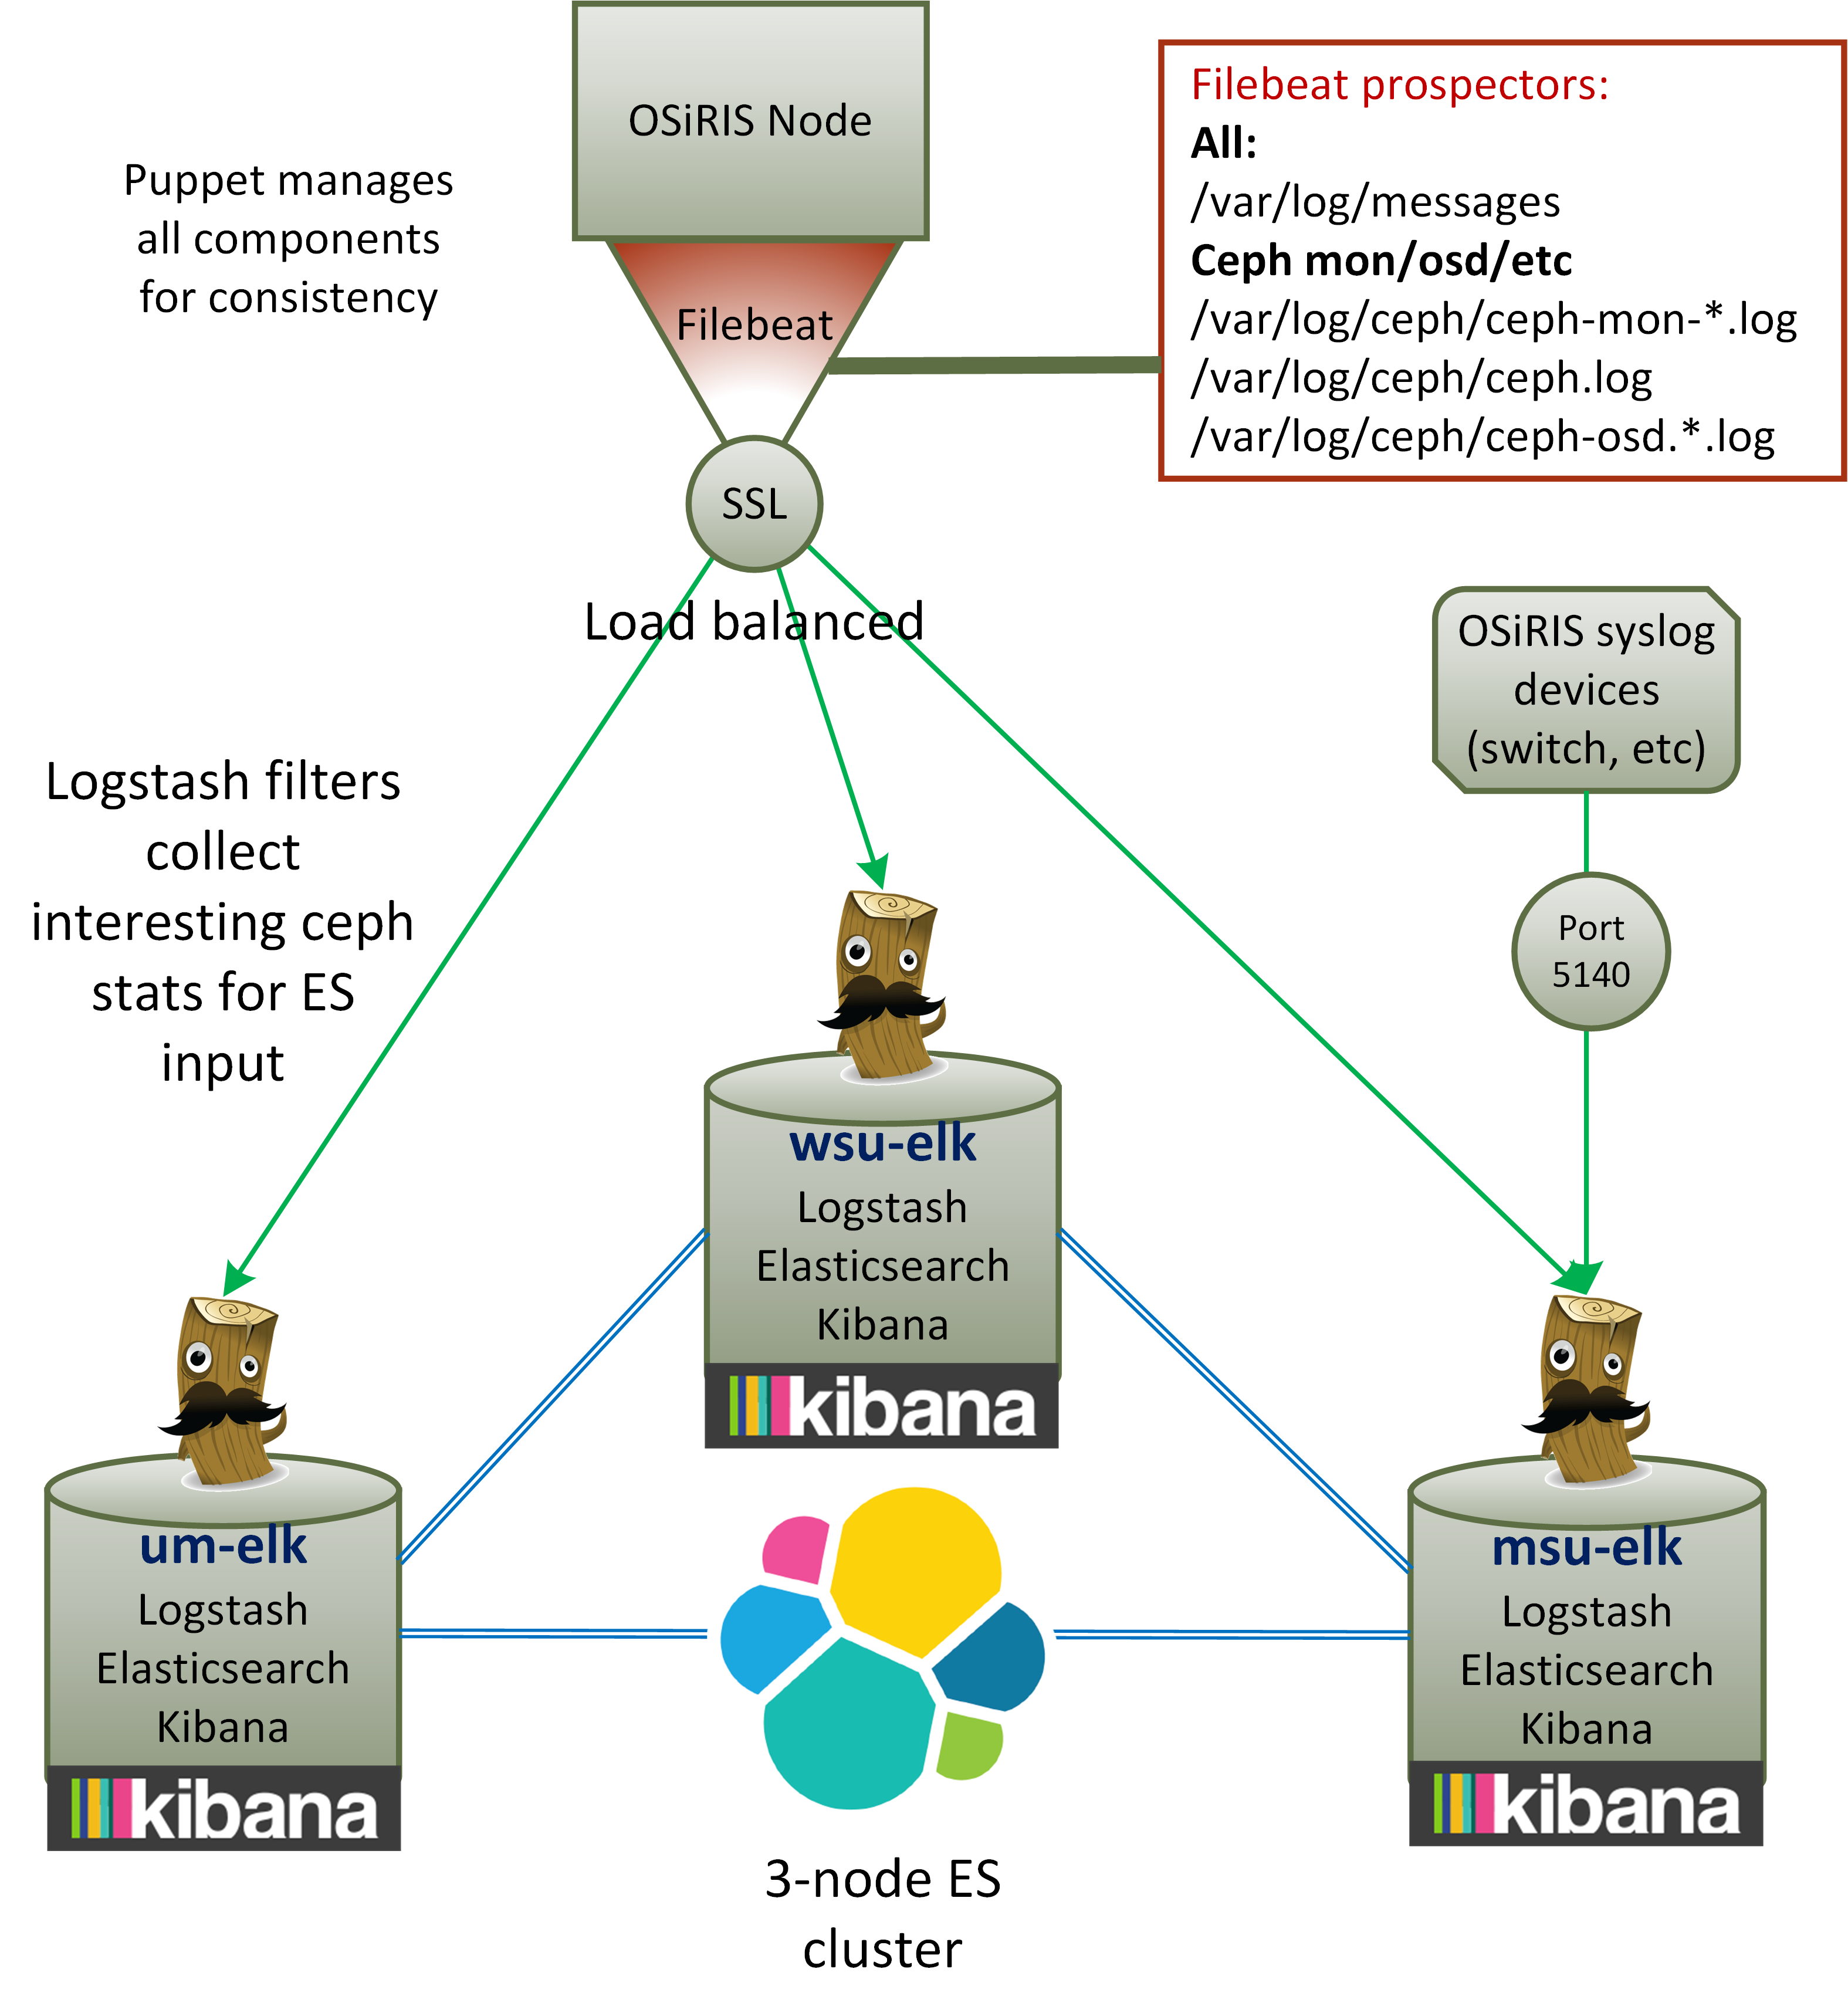
ELK Stack
Log collection and aggregation uses the “ELK” stack and Filebeat for shipping logs to Elasticsearch Cluster. We collect logs from syslog files, from Ceph log files, and also logs from devices such as switches. These are all fed into Logstash.
For log searching and visualization we use Kibana. Grafana can also use Elasticsearch data for generating plots though it is not as convenient as other inputs from time-series databases