The influxdb ceph-mgr plugin
My Do, University of Michigan
The Ceph-mgr plugin, influx, was written to simplify the process of retrieving cluster performance counters and to visualizing them on a dashboard. This influx plugin will periodically retrieve the performance counter and send data points to influxdb where it can be queried by a dashboard such as Grafana.
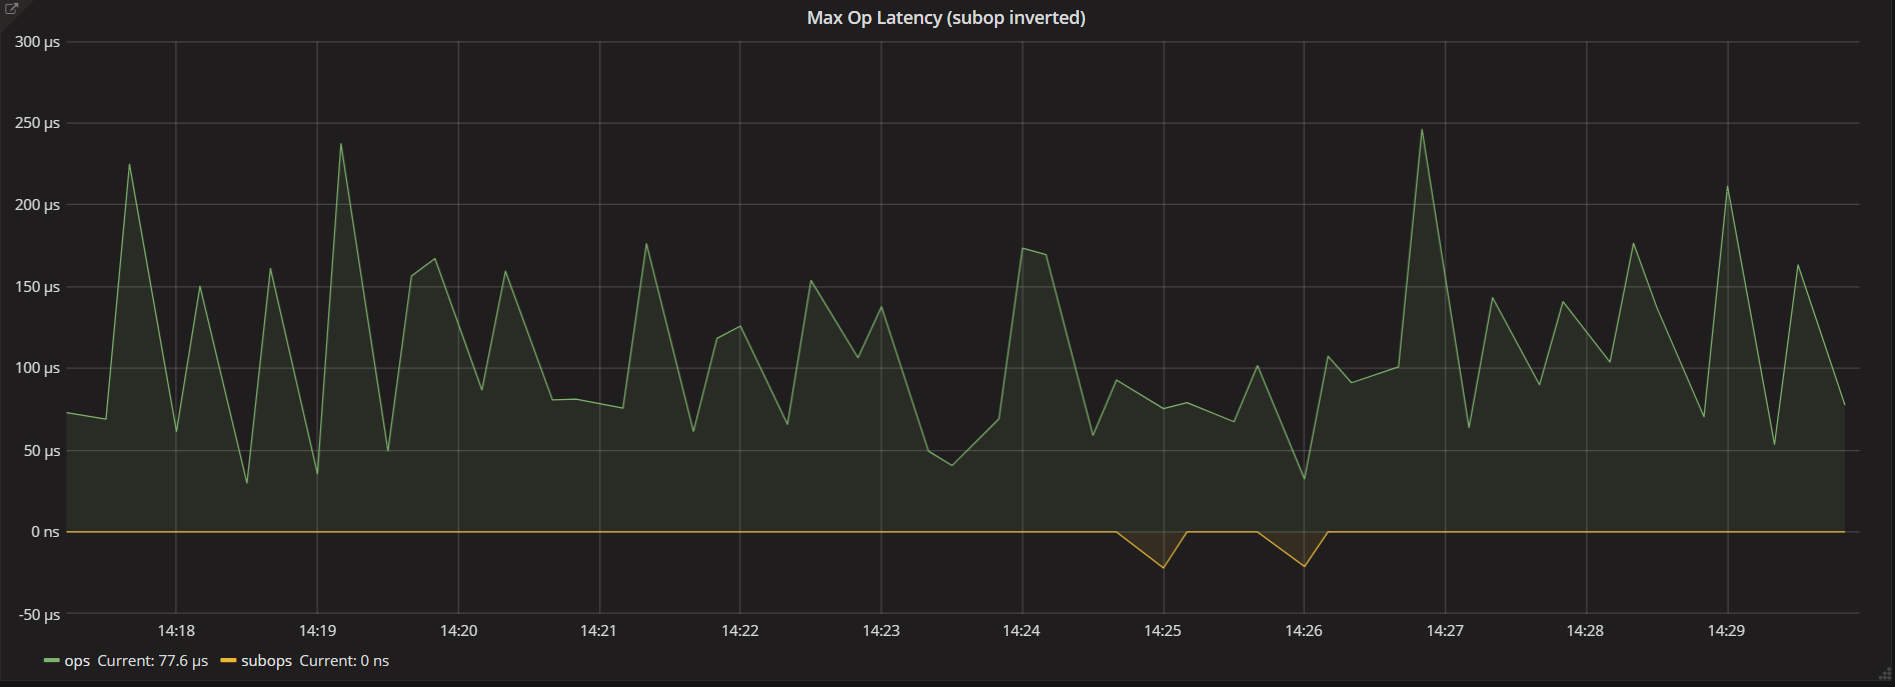 Max Operation Latency
The plugin has the ability to retrieve pool and osd counters as well as pg summary counters. There are two different methods of structuring the plugin depending on which of version of Ceph is being used. More on this will be discussed later in the article.
In order for the plugin to function, there are a couple of main components that are required. This includes the init, serve, and shutdown functions. These functions allow the plugin to run, so there is not much variation and most ceph-mgr plugins utilized the same structure. Examples of the basic structure of these functions can be seen below.
    def __init__(self):
        super(Module, self).__init__(*args, **kwargs)
        self.event = Event()
        self.run = True

    def shutdown(self):
        self.log.info('Stopping influx module')
        self.run = False
        self.event.set()

    def serve(self):
        if InfluxDBClient is None:
            self.log.error("Cannot transmit statistics: influxdb python "
                           "module not found.  Did you install it?")
            return
        self.log.info('Starting influx module')
        # delay startup 10 seconds, otherwise first few queries return no info
        self.event.wait(10)
        while self.run:
            ...
In order to send the data points to influx, at least the hostname, interval, and database must be set and retrieved. Ceph-mgr plugins use config-keys which are set once using the ceph config-key put <keyname> <value> command. self.get_config(<keyname>) can be used to get the config-key in the python module. If authorization is turned on for influxdb, username and password are additional keys that will be required.
Other functions that are needed are the functions that retrieve the specific performance metric. Performance metrics can be retrieved about the pool and osd. Pg summary metrics, such as “active+clean”, can also be retrieved. The function that retrieve the pool metrics is very similar to the function that retrieves the pg summary metrics. In the get_df_stats() function, information about the pool is pulled from self.get("df"). From there, we can loop through the different metrics about the pool and format it as a json data point to be sent to influxdb.
    def get_df_stats(self):
            df = self.get("df")
            data = []

            df_types = [
                'bytes_used',
                'dirty',
                'rd_bytes',
                'raw_bytes_used',
                'wr_bytes',
                'objects',
                'max_avail'
            ]
    ...
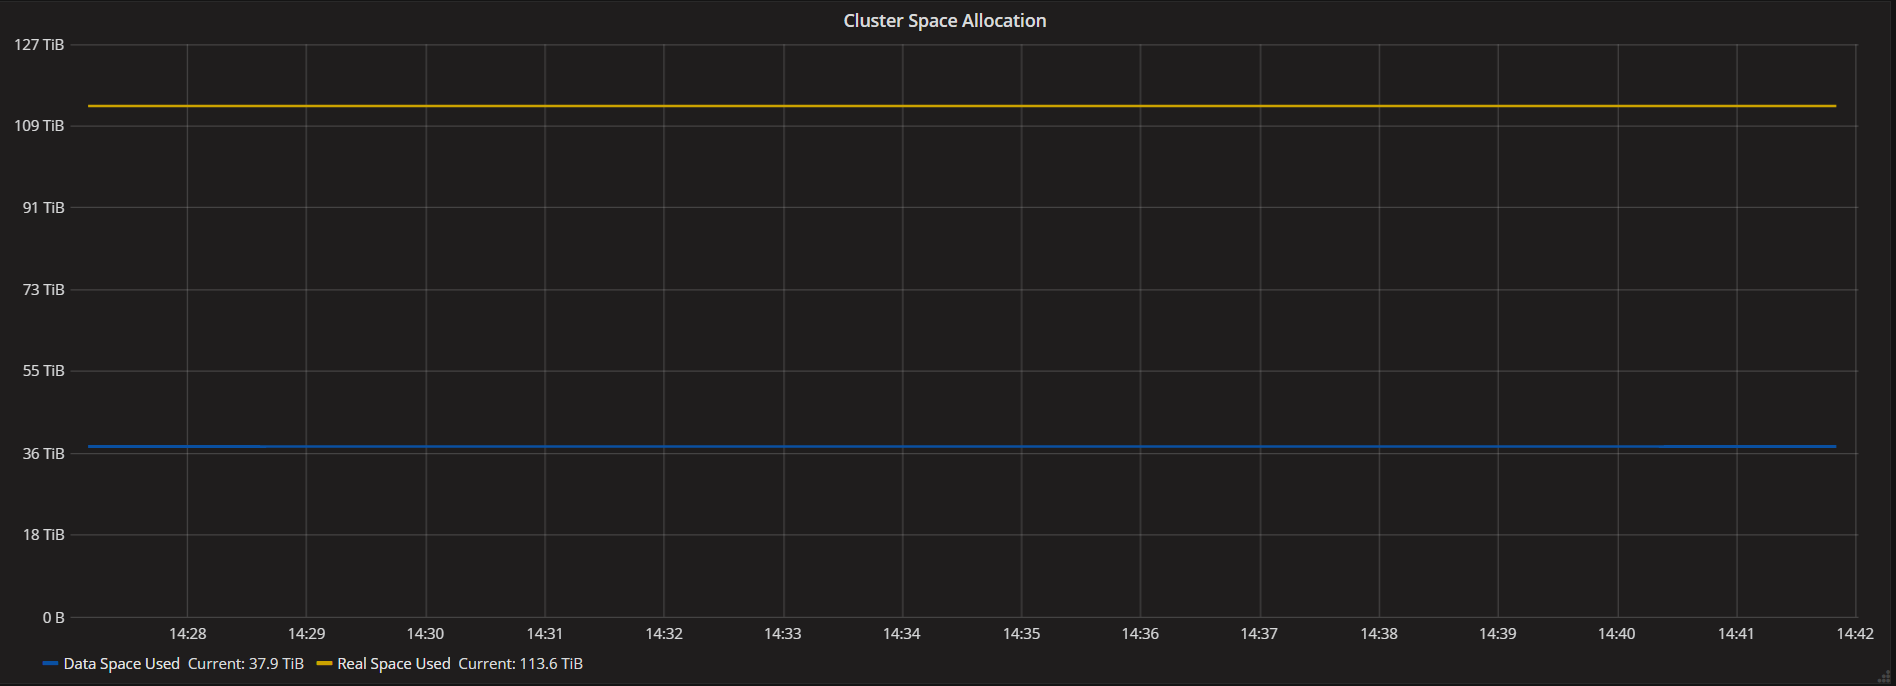 Cluster Space Allocated
In the get_pg_summary() function, information about the pool and osd can be pulled from self.get('pg_summary'). From there, we can decide whether we want to get osd or pool information, loop through it to pull out specific stats and format it as a json data point.
    def get_pg_summary(self, pool_info):
        osd_sum = self.get('pg_summary')['by_osd']
        pool_sum = self.get('pg_summary')['by_pool']
        mgr_id = self.get_mgr_id()
        data = []
        for osd_id, stats in osd_sum.iteritems():
            metadata = self.get_metadata('osd', "%s" % osd_id)
            for stat in stats:
                ...
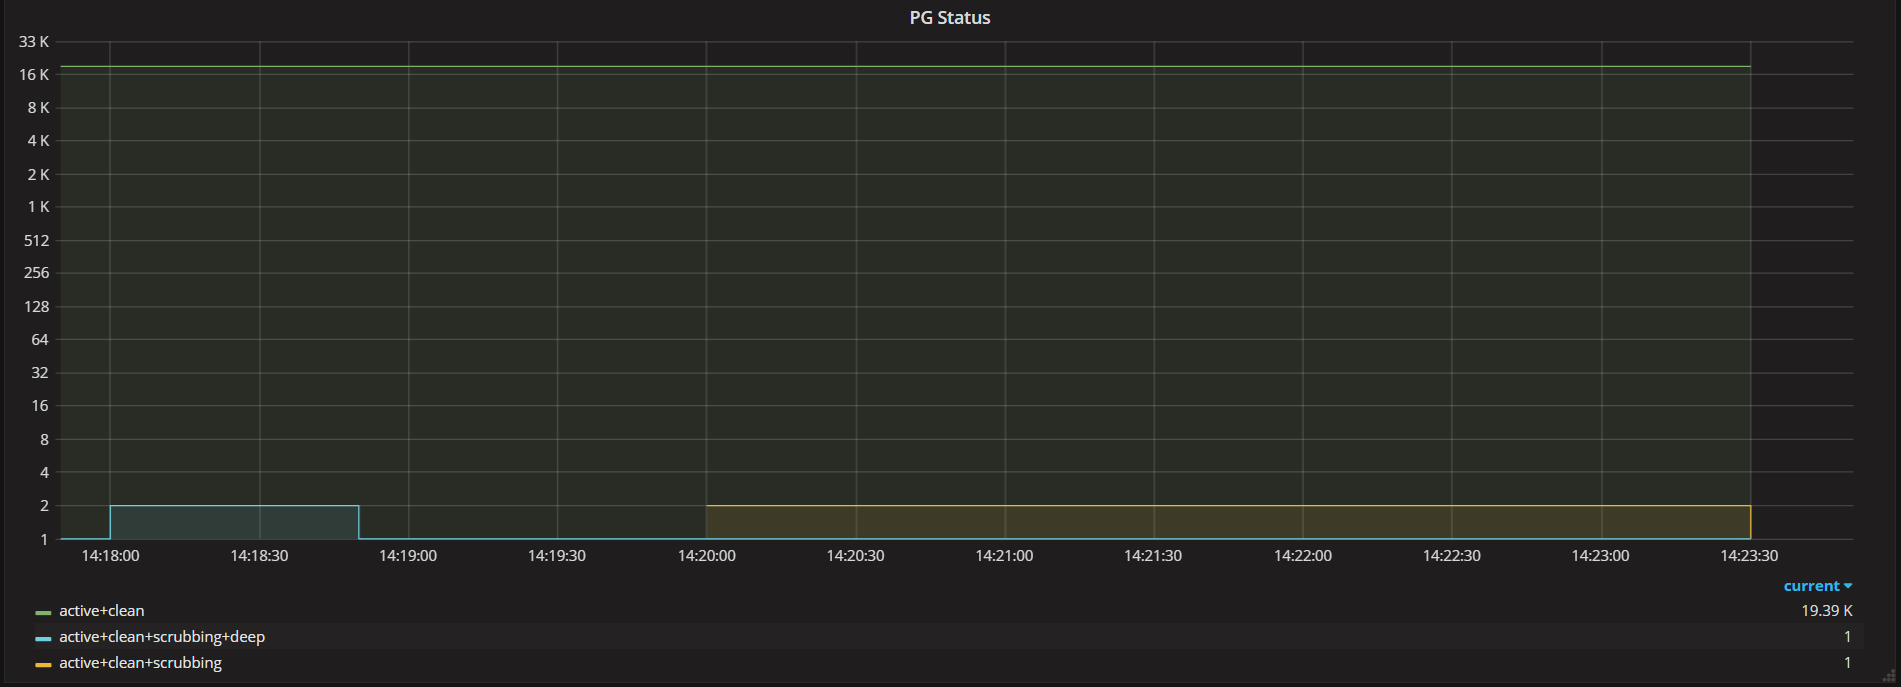 Pg Status
As for the osd metrics, there are two ways to retrieve these stats. In the current Luminous version of Ceph, this function is structured similar to the pool and pg summary functions. The only difference is that stats are retrieved from self.get('osd_map')['osd']. Similarly to the function that gathered the pool stats, we would need to loop through all the specific stats that we want per osd and format it into a json data point.
In the master version of Ceph, all the performance counters per osd can be retrieved at once. There is not a need to specify which counters to retrieve unlike the luminous version of this function. Like the other functions, the stat will need to be formated into a json data point.
    def get_daemon_stats(self):
        data = []

        for daemon, counters in self.get_all_perf_counters().iteritems():
            svc_type, svc_id = daemon.split(".")
            metadata = self.get_metadata(svc_type, svc_id)
            ...
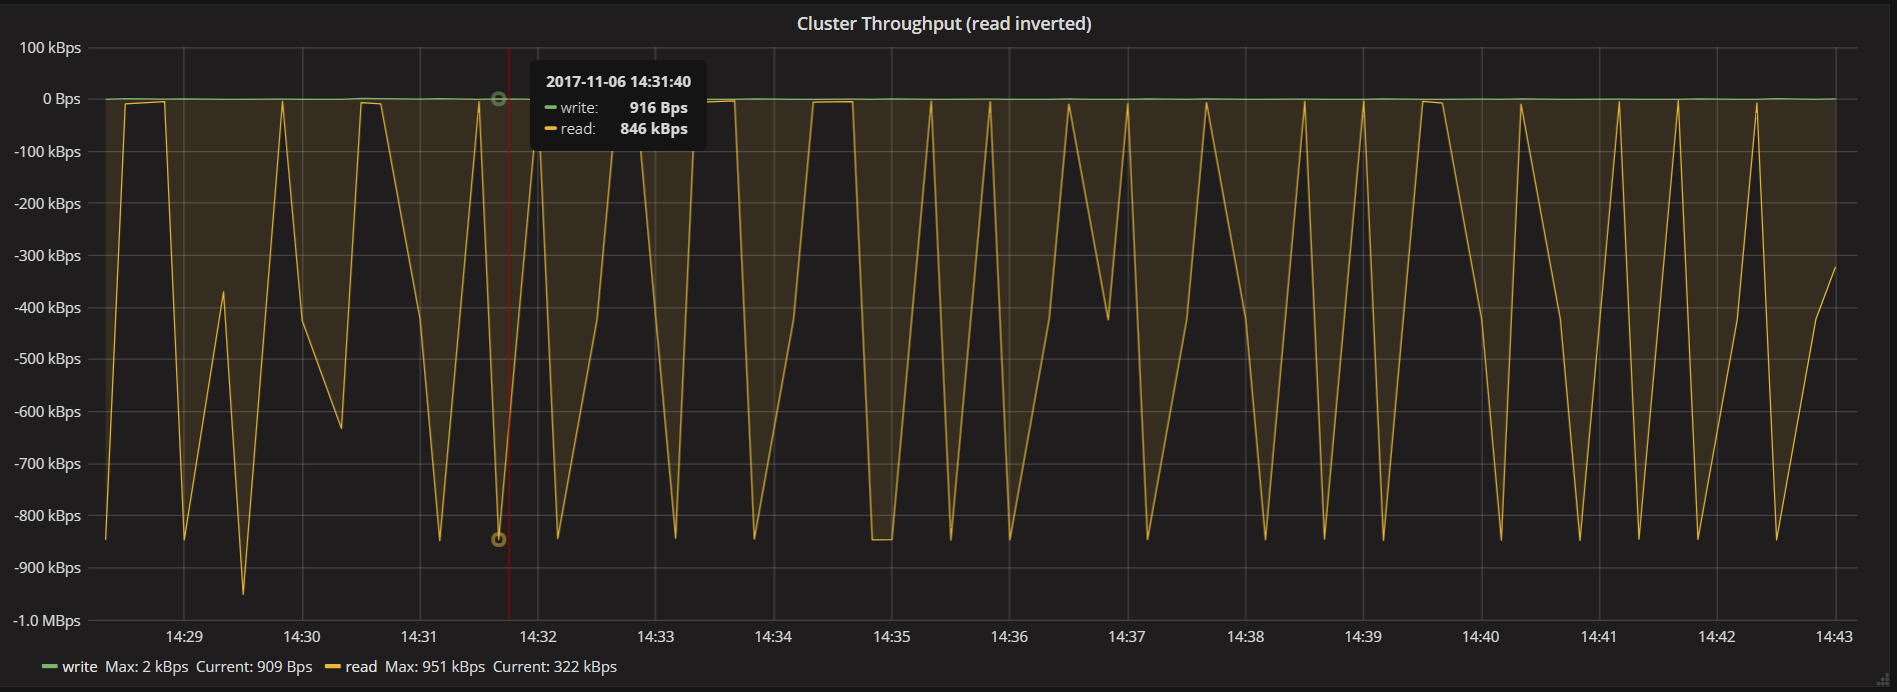 Cluster Throughput
The general format of the json data point can be seen below, but this could be modified according to how the user wants to sort and organize their data.
    json_body = [
        {
            "measurement": "cpu_load_short",
            "tags": {
                "host": "server01",
                "region": "us-west"
            },
            "time": "2009-11-10T23:00:00Z",
            "fields": {
                "value": 0.64
            }
        }
    ]
For more information on the influxdb module you can check out the Ceph Documentation or most current code in the Ceph git repository. The module was initially contributed to the Ceph tree by the author of this article My Do.
Tags