NMAL
Summary
The Network Management Abstraction Layer (NMAL) will extend PerfSONAR capabilities to include automated network topology discovery and tracking in the Unified Network Information Service (UNIS), and incorporate Software Defined Networking (SDN) into overall operations of the OSiRIS infrastructure.
We deploy PerfSONAR components both within OSiRIS and at our “client” locations to allow monitoring and measuring the networks interconnecting science domain users and OSiRIS components. Topology discovery (using a Ryu SDN controller application) and Flange Network Orchestration (NOS) rules are used to dynamically manage network pathing. At this point we are still in the experimental stages of network dynamic network management but have working proof of concept services and have also collaborated with the SLATE project to deploy and test our components in their infrastructure.
Dockerized deployments of UNIS, Flange, and topology discovery are available on Docker Hub.
Example application
We have demonstrated the use of NMAL orchestration capabilities in collaboration with SLATE (Services Layer at the Edge), controlling an Internet2 SDN testbed using SLATE-hosted resources to run the Flange NOS, UNIS topology service, and PerfSONAR network measurement containers. The Flange NOS software was used to control dynamic paths on a slice of the Internet2 SDN testbed along with resources provided by the SLATE platform. This testbed provided an evaluation opportunity for the developing NMAL components outside of the production OSiRIS storage network. We were able to demonstrate traffic flows being diverted dynamically between two different paths based on active measurement feedback. PerfSONAR measurement test points were used to provide active monitoring of each segment of the path controlled by Flange. A Flange declarative “program” was used to control the selection of traffic flow between SDN-enabled switches based on a predetermined measurement threshold applied on either a throughput or latency dimension.
The video below shows the Flange NOS control interface in action. The NOS GUI allows for specification of the declarative network program to run (the “flangelet”), a visualization of the topology with applied SDN flows, and the ability to inspect the live state of the executing policy. Additionally, the video overlays network performance plots to highlight the dynamic change in network pathing based on perceived congestion along the bottlneck path. A change in traffic flow and subsequent path switch can be observed at the 3:00m mark.
Here is the Flange network program used in this demonstration. It asserts that a bi-directional flow should exist between source and sink with the throughput and protocol constraints set by r.
let source = {x|x.name == "saltlake"}
let sink = {x|x.name == "kansas"}
let r = {f|f.proto = 1 and f.throughput_bps > 100000000}

exists source ~r> sink
exists sink ~r> source
Periscope
Periscope comprises a set of extensions to the standard PerfSONAR distribution as well as a client monitoring component and topology and data stores. The information collected by Periscope components is maintained in a hierachically deployed set of UNIS and Measurement Store (MS) instances.
UNIS
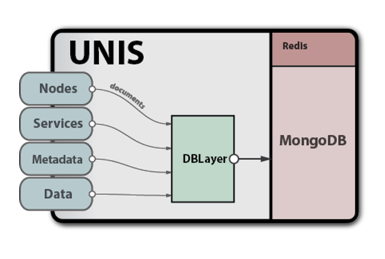
The Unified Network Information Service (UNIS) combines the capabilities of resource lookup and network topology services within a general data model and reference implementation. Accessible via a RESTful API, UNIS maintains descriptions of multi-layer topologies and associated measurement metadata along with the services running within as embedded objects, allowing UNIS to answer complex queries about the network and its current operational state. The UNIS data model is expressed as a hierarchical set of schema definitions that have recently been extended to represent file and object metadata, known as exNodes.
As an extension to the UNIS service, measurement store (MS) endpoints are exposed to provide timeseries measurement data collected from agents such as BLiPP.
BLiPP - Basic Lightweight Periscope Probe
BLiPP is a flexible framework for collecting host metrics for reporting metadatas back to the network information store (UNIS). The BLiPP framework supports the model of a generalized measurement point: any allowed host command may be executed to gather a set of metrics and the parsed values are normalized into timeseries data and sent to one or more Periscope measuement stores.
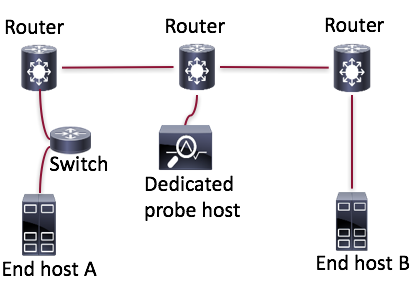
Every OSiRIS node runs a BLiPP agent. These agents may reside in both the end hosts (monitoring end-to-end network status) and dedicated diagnostic hosts inside networks. The latter deployment can help isolate section failures of networks. In our context the PerfSONAR nodes deployed at each member site and many client/user sites function as diagnostic hosts but the BLiPP agent is also running on our end hosts.
Topology Discovery and Monitoring
Here is a sample of the topology map put together by querying SDN instances on OSiRIS switches and hosts. This map can be combined with the metrics collected from Periscope and BLiPP to understand network characteristics and make best-path determinations.
 Discovered topology information with path overlay (learned from Ryu-based application)
Our goal is to leverage this dynamic topology information in conjunction with performance metrics gathered by PerfSONAR/Periscope to generate network pathing rules propogated to our network by the Flange NOS.
Additionally, we are building monitoring dashboards that combine the learned topology with active measurements collected between OSiRIS deployment sites. The intent is to provide an interface that allows both administrators and users to better understand and debug the current network state.
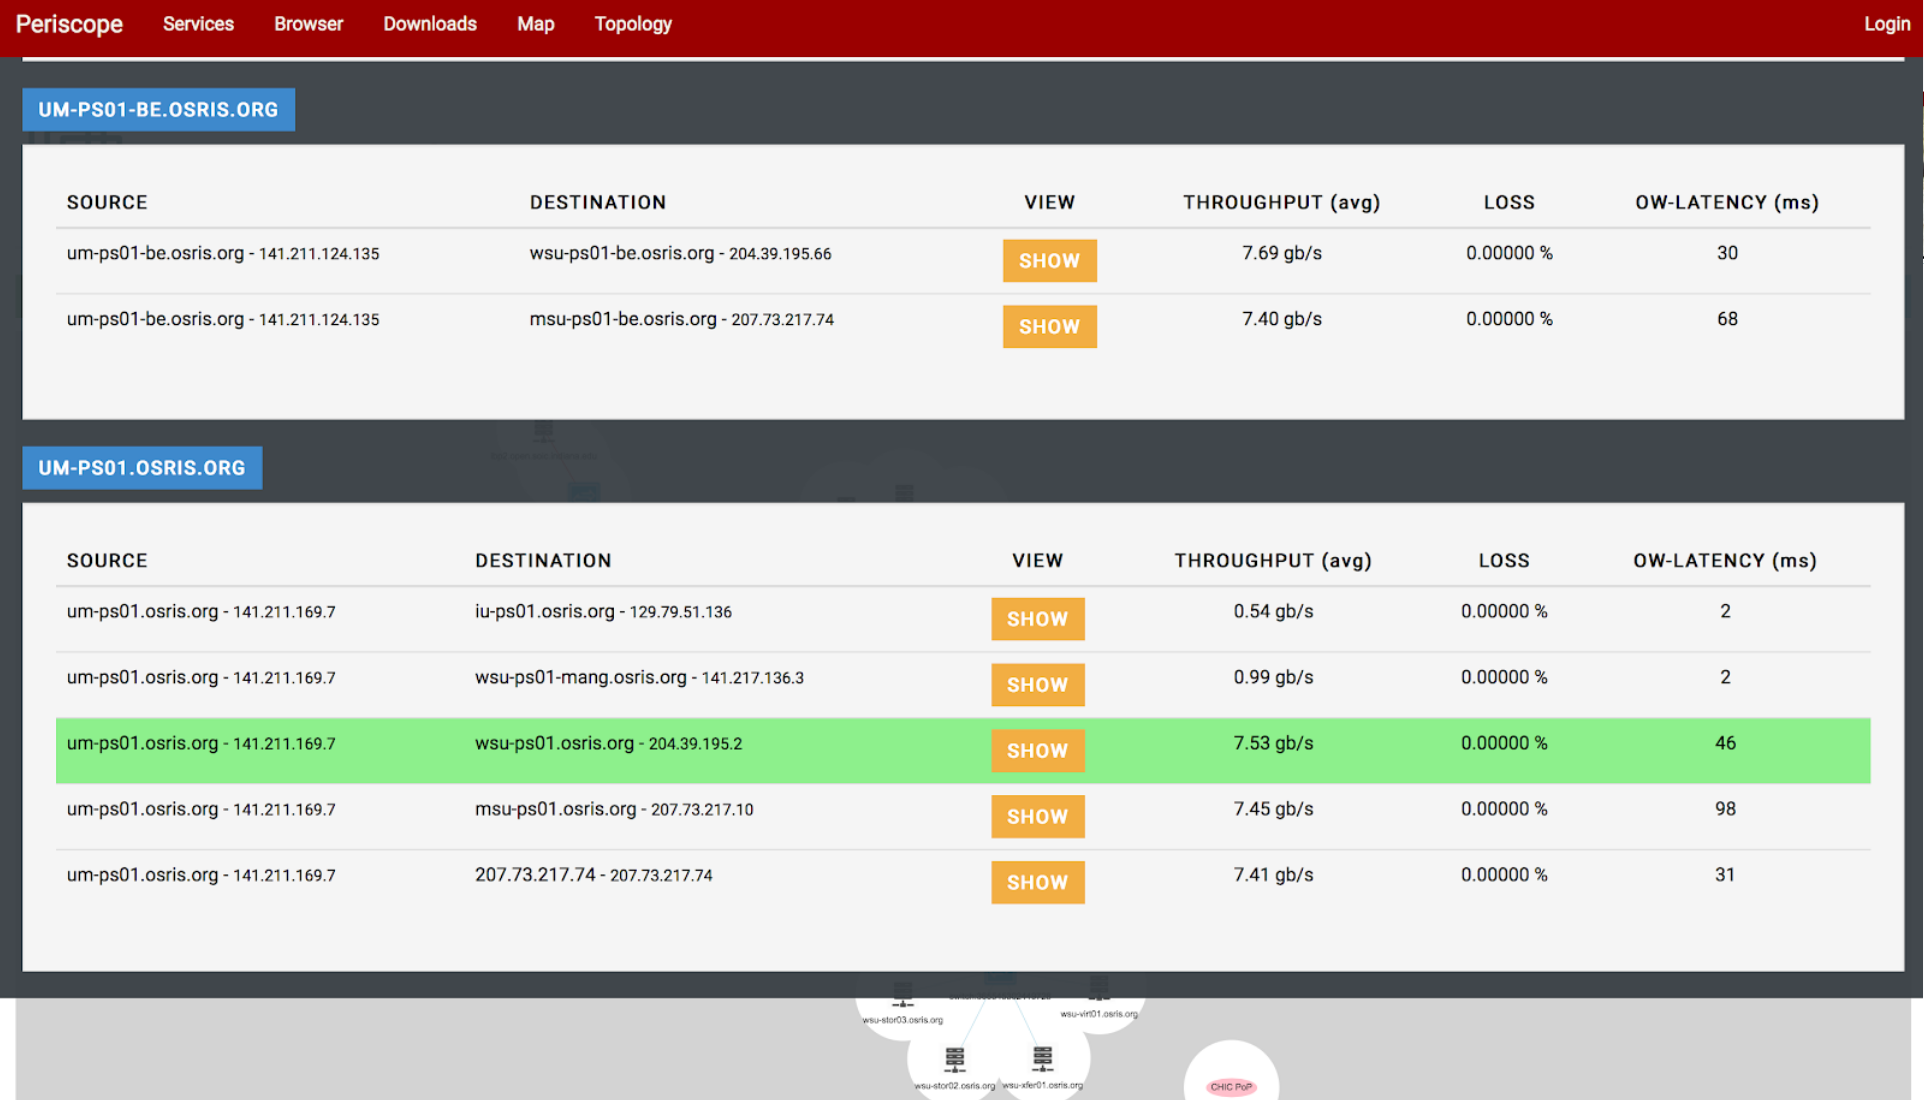 Periscope monitoring dashboard displaying measurements for actively monitored topology components
SDN Configuration
Deployed at each site is an SDN controller which is linked to the OSiRIS switch at that site (Dell Z9100). They are centrally managed by a core SDN controller fed information from the UNIS data store.
The configuration to enable this is fairly simple. An openflow instance is required, and vlans on the switch must be configured to be part of that instance. In the absence of any openflow configuration from the controller the VLANs continue to behave as normal. In practice, we also configure a secondary controller that serves as a failsafe with only the normal switching flow-mods in place.
openflow of-instance 1
 controller 1 10.10.1.1 port 1234 tcp
 interface-type vlan
 multiple-fwd-table enable
 of-version 1.3
 no shutdown
Vlans are configured as in the non-SDN case but must be defined as part of the openflow instance. They have to be re-defined if already configured, they cannot be switched after.
interface vlan 1234 of-instance 1
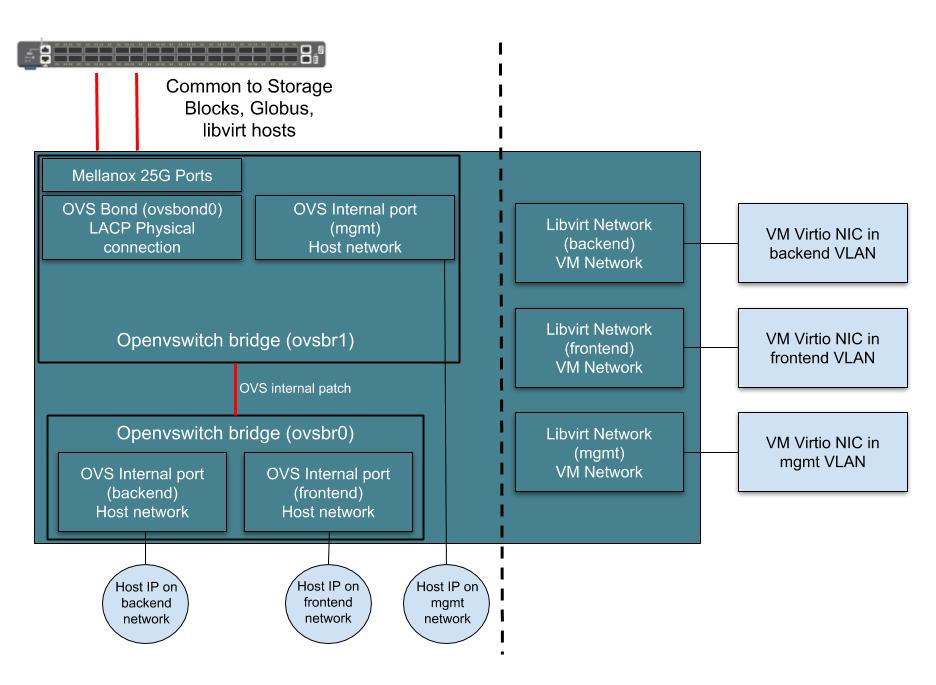
All of our hardware hosts with some multiple of 25Gb NICs are configured with Openvswitch for the core networking so they also can be controlled by openflow. Generally the 25Gb interfaces are combined into an OVS bond and ports are configured on the OVS for host networking. Virtualization hosts have libvirt networks configured to utilize the vswitch for VM networking.